
Identifying changes between filings means finding exactly what moved from one version of a submission to the next: which rates shifted, which factors changed, which rules were added or removed. Where comparing wording is about contract language, this is about the numbers and logic, the pricing and rules deltas that decide what a customer actually pays.
This is how to isolate those changes efficiently, and how to avoid the common trap of noticing a headline figure moved without understanding what actually drove it.
serff.ai is built to do that for you: it indexes millions of SERFF filings and lets you ask questions in plain English instead of opening documents one by one. You can connect it to the AI assistant you already use: Claude or ChatGPT, via the serff.ai MCP server, or work directly in the web platform.
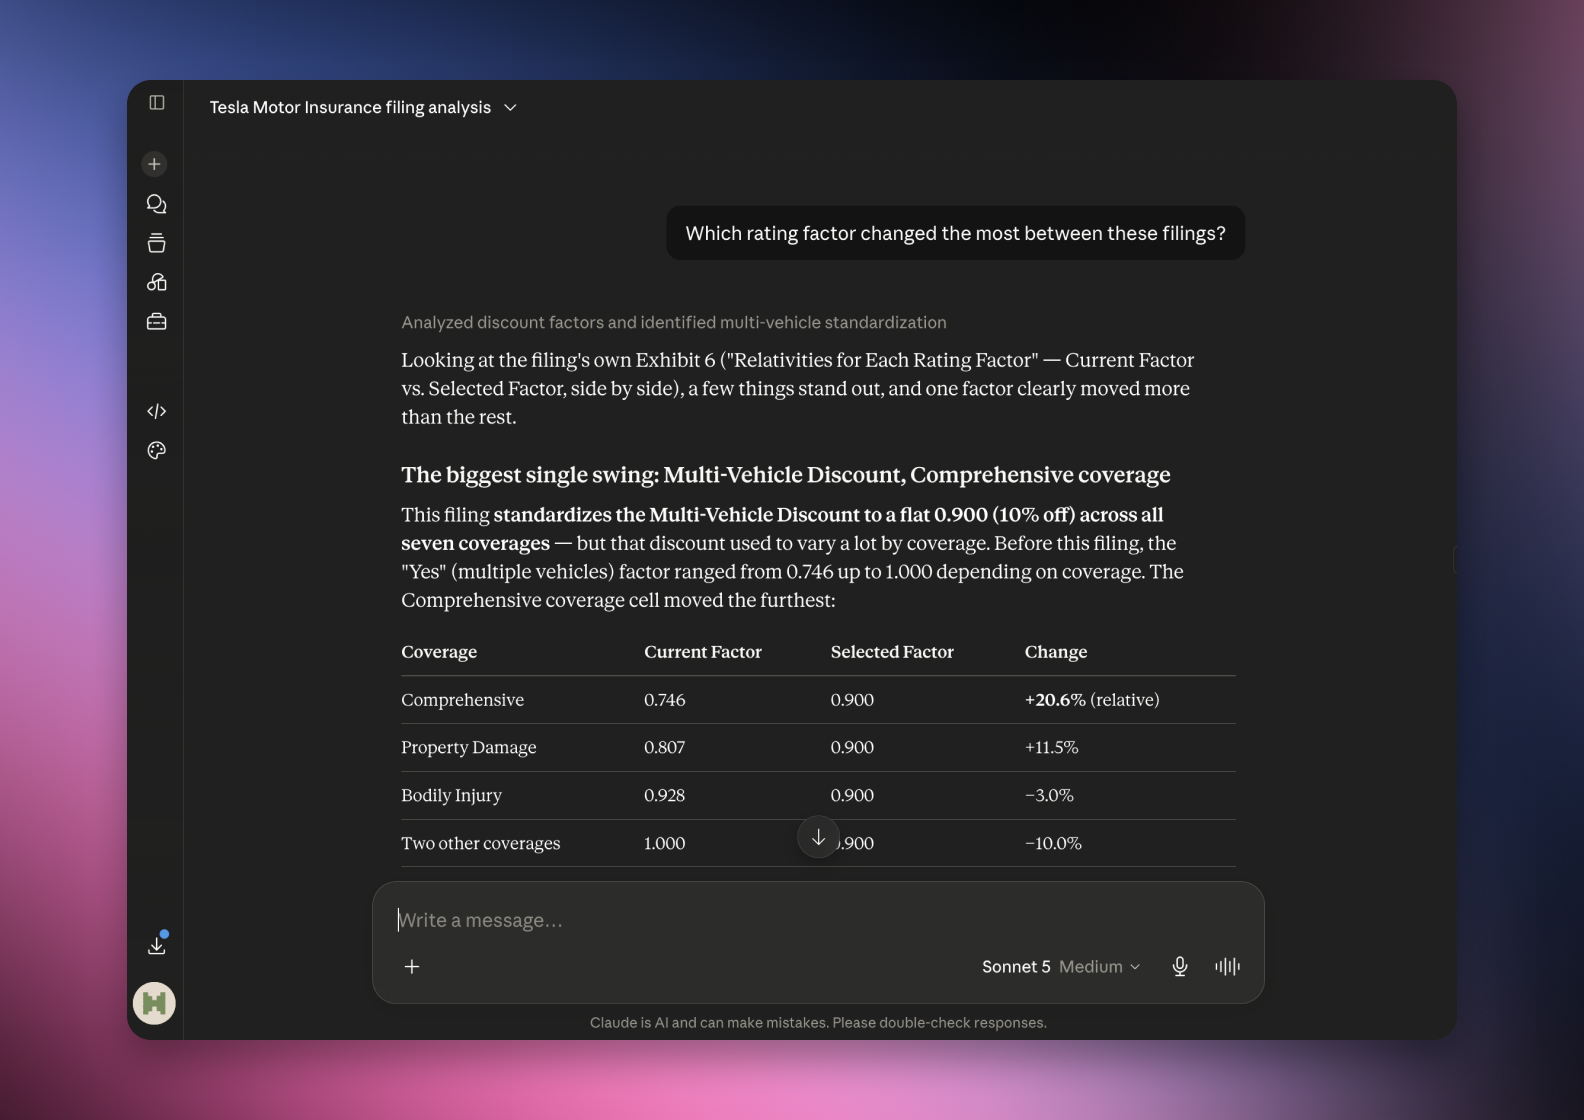

Connected via MCP to the AI you already use, Claude or ChatGPT, or through our dedicated platform, serff.ai makes searching and analysing SERFF filings effortless. A change becomes a single question: ask what moved between two filings, or what drove a specific delta, and get a grounded, cited answer in seconds.
The manual way
Diff rate pages between two filing versions by hand.
With serff.ai, just ask
“What changed in the rate pages between these two filings?”
The manual way
Work out which specific factor drove a headline change.
With serff.ai, just ask
“Which rating factor changed the most between these filings?”
The manual way
Check whether rules changed alongside the rate.
With serff.ai, just ask
“Did the rating rules change along with the rate in this filing?”
The manual way
Trace a change back to its stated justification.
With serff.ai, just ask
“What does the actuarial memorandum say justified this change?”
Every answer is cited back to the exact page of the source PDF and grounded only in filed values, with no invented numbers, so you can trust it the way this audience needs to. Research that took weeks takes a prompt.
No credit card required. Simply sign up and connect to Claude or ChatGPT or use Swallow’s SERFF.ai platform.
Start with the rate information summary for the headline figures, then move into the rating factors and rule tables for the detail behind them. The headline number tells you that something changed; the tables tell you what.
A headline rate change can come from one factor moving a lot, several factors moving a little, or a rule change that shifts how factors combine without any single factor value changing at all. Confirming which of these is happening is what separates a surface read from an accurate one.
If the headline rate change seems large relative to any single factor table change, check the rating algorithm and rules for a change in how factors combine, rather than assuming a data error.
The actuarial memorandum should account for what actually moved. If the stated justification, say, a specific trend adjustment, doesn't obviously map to the scale of the factor changes you found, that gap is worth a closer look, and is often exactly what an objection letter would raise.
Don't stop at the headline figure. Two filings with an identical overall rate change can distribute that change very differently across factors, and the distribution is often what matters most to specific policyholders.
Identifying changes between filings means moving past the headline rate figure into the factor and rule tables to find what actually drove it. Check that the actuarial reasoning matches the scale of what changed, since a mismatch is often the most telling signal in the comparison.
Wording changes are about policy contract language; filing changes here focus on rate, factor and rule deltas, the pricing and eligibility logic rather than coverage text.
Start with the rate information summary for the headline figures, then move into the factor and rule tables for the detail behind them.
Yes. A rule or algorithm change can shift how factors combine, producing a headline change without a large move in any single factor value.
Check whether the actuarial memorandum's stated reasoning plausibly accounts for the scale of what actually changed in the factor tables.
Two filings with the same overall change can distribute it very differently across factors, meaning different customers are affected in different ways.





 ChatGPT
 Claude
.png)
.png)
.png)
.png)