
An actuarial exhibit is a supporting document in a rate filing that shows the calculations behind a rate change: the data tables, experience triangles, trend and loss development workings and factor derivations that a rate indication is built on. If the actuarial memorandum is the argument, the exhibits are the workings that prove it.
Exhibits are where a regulator checks whether the numbers actually support the conclusion. Reading them well means tracing each figure back to its source and following the arithmetic from raw experience to indicated rate.
serff.ai is built to do that for you: it indexes millions of SERFF filings and lets you ask questions in plain English instead of opening documents one by one. You can connect it to the AI assistant you already use: Claude or ChatGPT, via the serff.ai MCP server, or work directly in the web platform.
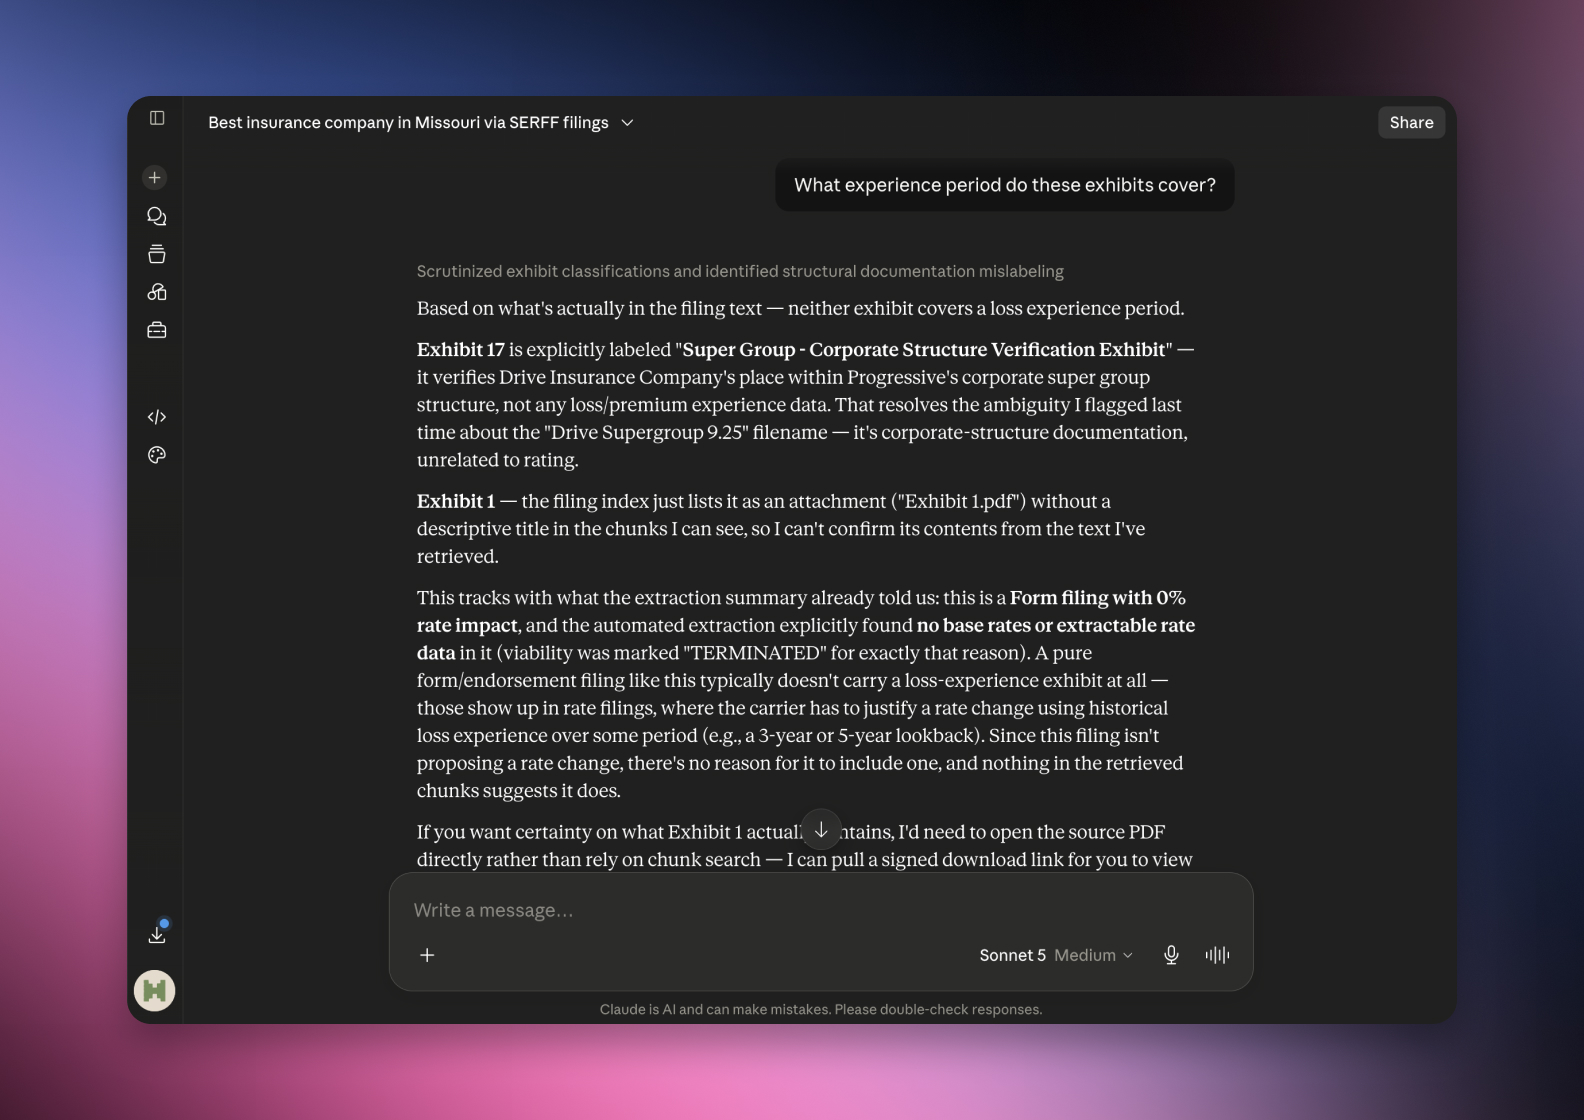

Connected via MCP to the AI you already use, Claude or ChatGPT, or through our dedicated platform, serff.ai makes searching and analysing SERFF filings effortless. An actuarial exhibit becomes a single question: ask where a number comes from, how a factor was derived, or what data period was used, and get a grounded, cited answer in seconds.
The manual way
Trace a figure through pages of exhibit tables.
With serff.ai, just ask
“Where does this number come from in the exhibits?”
The manual way
Work out which experience period the indication uses.
With serff.ai, just ask
“What experience period do these exhibits cover?”
The manual way
Follow a loss development or trend calculation by hand.
With serff.ai, just ask
“How was the trend factor derived?”
The manual way
Reconcile the exhibits against the memorandum's claims.
With serff.ai, just ask
“Do the exhibits support the indicated rate change?”
Every answer is cited back to the exact page of the source PDF and grounded only in filed values, with no invented numbers, so you can trust it the way this audience needs to. Research that took weeks takes a prompt.
No credit card required. Simply sign up and connect to Claude or ChatGPT or use Swallow’s SERFF.ai platform.
Exhibits vary by product and method, but most rate filings share a recognisable set of workings that move from raw experience to a final indication.
Those workings underpin the actuarial memorandum, which narrates what the exhibits show.
The two are easy to confuse because they travel together. The actuarial memorandum is the written argument for the rate change: what was done and why. The exhibit is the numerical evidence behind it: the tables and calculations the argument rests on. You read the memorandum to understand the case, and the exhibits to verify it.
Exhibits are where a rate filing is tested. A regulator, or a competitor reading the filing, checks whether the trend selection is reasonable, whether the development factors are supported, and whether the indicated change follows from the data. This is also the section that objection letters most often question.
Some exhibits can be filed as confidential and withheld from public view. If the memorandum refers to an exhibit you cannot see, the reasoning may still be sound; the workings are simply not public.
Anchor yourself first in the memorandum so you know what each exhibit is meant to show, then trace the arithmetic: raw experience, developed and trended, run through the method to an indication. Check that the rate information numbers reconcile with what the exhibits produce.
An actuarial exhibit is the numerical evidence behind a rate change: the experience, development, trend and factor workings that produce an indication. The memorandum makes the case; the exhibits prove it, which is why regulators scrutinise them most.
It is a supporting document in a rate filing that shows the calculations behind a rate change, including experience data, loss development, trend and factor derivations.
The memorandum is the written argument for the change; the exhibit is the numerical evidence, the tables and calculations, that the argument rests on.
Often much of a filing is public through SERFF Filing Access, but certain exhibits can be filed as confidential and withheld from public view.
Loss development is the process of adjusting immature loss data to its expected ultimate level, using factors derived from historical patterns.
Because exhibits are where a rate indication is proven or challenged. They show whether the data actually supports the requested change.





 ChatGPT
 Claude
.png)
.png)
.png)
.png)