
Comparing insurance companies through their filings means using public regulatory data to answer competitive questions: who is pricing more aggressively, who is expanding into new states or products, whose filings draw the most regulator scrutiny. It turns a set of individually mundane filings into a genuine competitive intelligence source.
This is how to structure that comparison so it produces a fair read on strategy and positioning, rather than a misleading snapshot based on incomplete or mismatched data.
serff.ai is built to do that for you: it indexes millions of SERFF filings and lets you ask questions in plain English instead of opening documents one by one. You can connect it to the AI assistant you already use: Claude or ChatGPT, via the serff.ai MCP server, or work directly in the web platform.
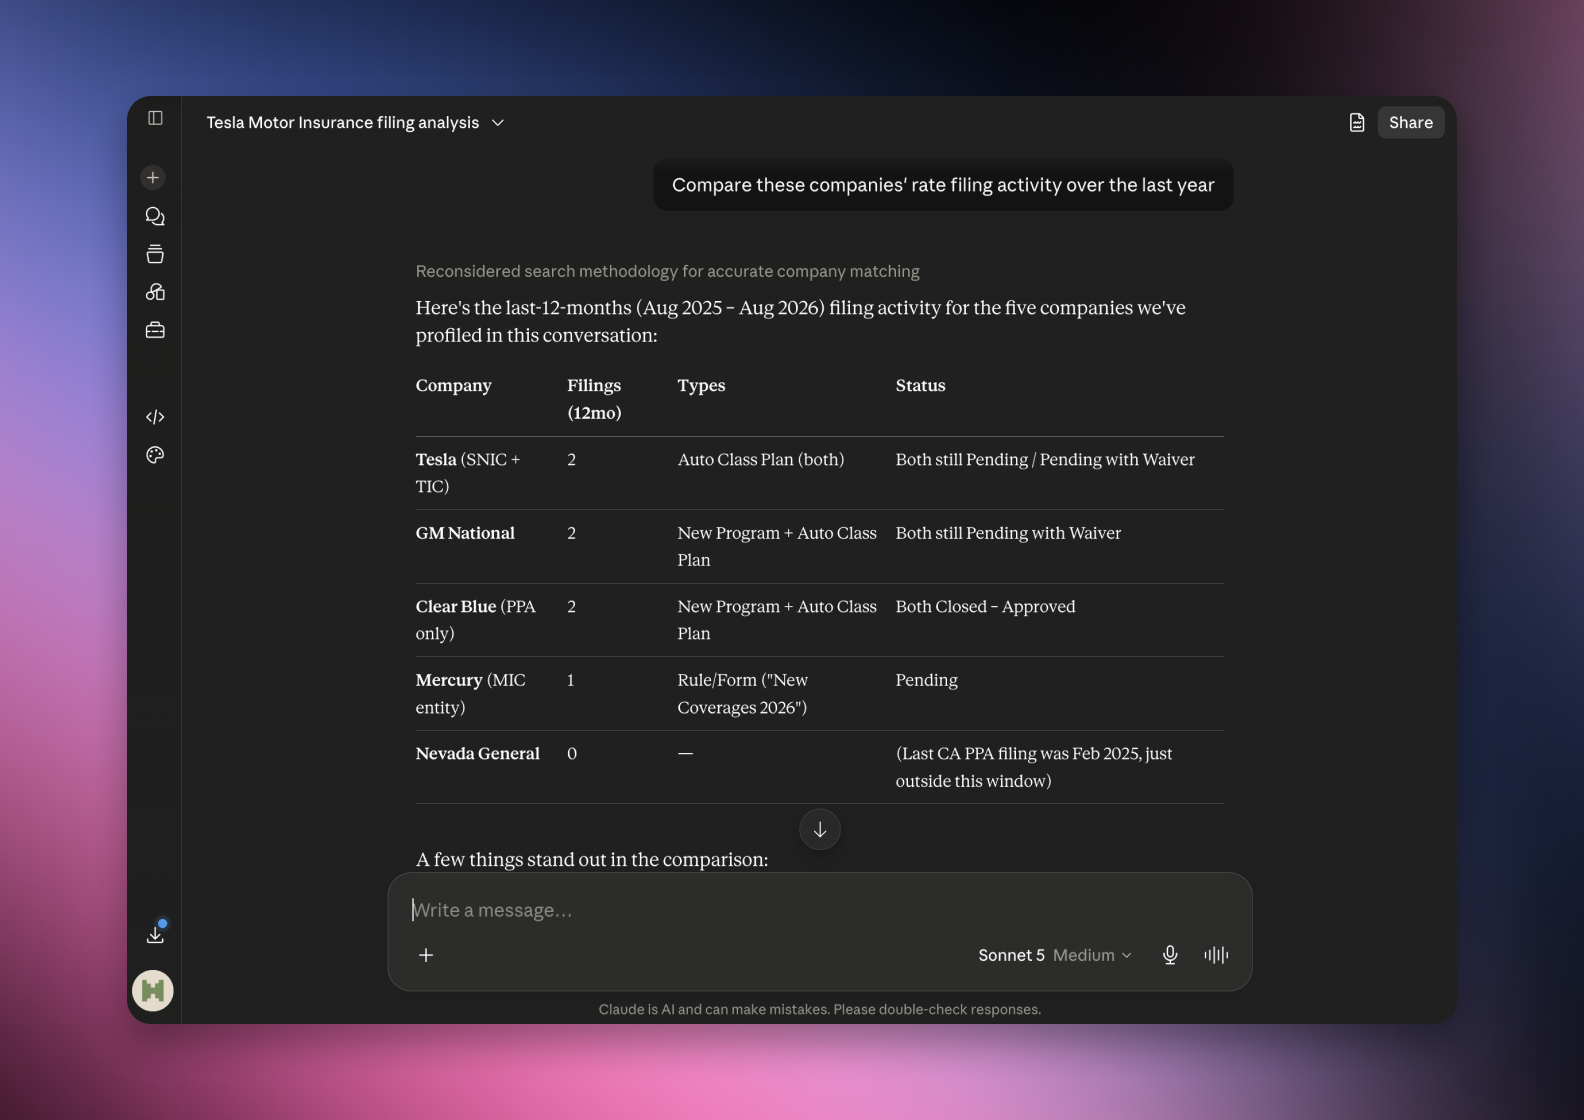

Connected via MCP to the AI you already use, Claude or ChatGPT, or through our dedicated platform, serff.ai makes searching and analysing SERFF filings effortless. A competitor comparison becomes a single question: ask how two companies' pricing or activity compares, and get a grounded, cited answer in seconds.
The manual way
Build a separate filing history for each competitor by hand.
With serff.ai, just ask
“Compare these companies' rate filing activity over the last year.”
The manual way
Work out who is pricing more aggressively in a product line.
With serff.ai, just ask
“Which of these companies has filed the largest rate increases?”
The manual way
Track which competitor is expanding into new states first.
With serff.ai, just ask
“Which company has filed in the most new states recently?”
The manual way
Check whose filings draw the most regulator pushback.
With serff.ai, just ask
“Which company's filings receive the most objections?”
Every answer is cited back to the exact page of the source PDF and grounded only in filed values, with no invented numbers, so you can trust it the way this audience needs to. Research that took weeks takes a prompt.
No credit card required. Simply sign up and connect to Claude or ChatGPT or use Swallow’s SERFF.ai platform.
Before comparing, assemble each company's filing history individually, including its subsidiaries. A comparison built on an incomplete picture of even one company will misrepresent the whole exercise.
Companies of different sizes and different state footprints will naturally show different raw numbers. Normalise where you can, comparing rate change percentages rather than raw dollar figures, and comparing filing pace relative to each company's typical volume rather than an absolute count.
If you're benchmarking pricing strategy specifically, look at the pattern across several filings from each company rather than one. A single filing can be an outlier for reasons that have nothing to do with overall strategy.
A company that files frequently in small increments is signalling something different from one that files rarely in large moves. A company expanding into new states or product lines is signalling growth intent, while one narrowing its underwriting guidelines may be pulling back from a segment. The pattern across many filings tells the strategic story better than any single one.
Don't read too much into one filing as evidence of a company's overall strategy. Build the comparison from a consistent set of filings across the same time period for every company involved.
Comparing companies through their filings means building each company's full picture first, then benchmarking pricing, product strategy, filing pace and regulator friction on a normalised, like-for-like basis. The strategic story lives in the pattern across many filings, not any single one.
Build each company's full filing history individually, including subsidiaries, then benchmark pricing, product activity and filing pace on a consistent, normalised basis.
Pricing activity, product strategy, filing pace and how often a company's filings draw regulator objections.
Normalise the data, comparing rate change percentages instead of raw figures, and filing pace relative to each company's typical volume.
Not reliably. A single filing can be an outlier; the strategic pattern is clearer across several filings over a consistent time period.
It can indicate the company is taking a more aggressive pricing or underwriting position than its regulators are comfortable approving without challenge.





 ChatGPT
 Claude
.png)
.png)
.png)
.png)